DIGITALBREAST TOMOSYNTHESIS (1)
INTRODUCTION
When we ed concern, but was not palpable, we would place needles in the breast (“needle localization”), guided by the images, to direct surgeons to the area so that the lesion could be excised to determine whether or not it was benign ormalignant (I developed the hookwire localization guide soon after). The surge on would send the excised tissue from the Operating Room for us to x-ray the specimen to confirm that the targeted lesion had been removed. I was struck by how much clearer lesions were seen on the specimen radiographs than they could be seen on the mammogram(Figure 1).
Figure 1
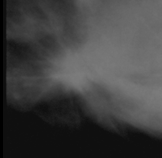
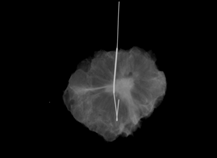
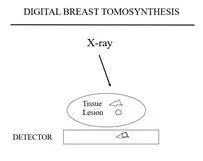
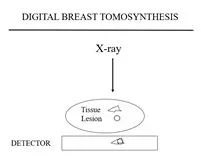
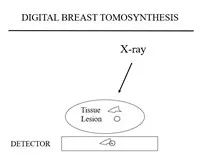
Figure 2a Figure 2b Figure 2c
Figure 3a
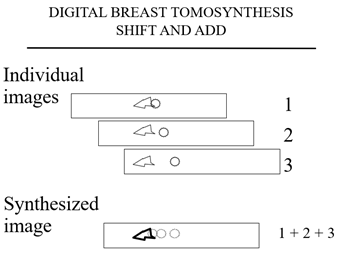
The plane containing the triangular tissues is in sharp detail while the cancer is out of plane and fades into the background.
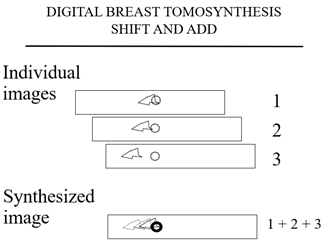
The computer then shifts the images and adds them again and this time (Figure 3b) the cancer is in shaper detail and the “tissue” fades into the background.
Figure 3b
Tomosynthesis differs from tomography described earlier because each of the tomosynthesis projection images only requires a fraction of the dose of a full exposure FFDM. Any number of “slices” or planes can be madethrough the breast from the handful of projection images.
The advantage of tomosynthesis is that the planes can have the full resolution of the projection images. The detail in the x and y directions is only limited by the resolution of the stationary system. Some have called DBT “3D mammography”, but this is not accurate. The “voxel” is not cubic. It is diamond shaped, depending on the angle through which the x-ray source is moved to obtain the projection images. The smaller the angle through which the projection images are obtained the more uncertainty in the “z”direction so that the narrower the angle of acquisition the “thicker” the slice. The only way to get true 3-Dimensions would be for the source to go beyond a 180 degree arc which would not work for the breast in a mammographic position and begins to parallel computed tomography.
NOT ALL DBT SYSTEMS ARE THE SAME
As with any x-ray system, DBT systems varyin their design and the quality of their images.
DETECTORS
There are two main, commercially available detectors. General Electric uses aproprietary detector on which cesium iodide crystals are “grown” in columns on the detector. The x-rays are converted to light in the crystals and the light is then converted to an electrical signal.
The other main detector configuration use samorphous selenium. This is very similar to the Xeroradiography system that was used years ago to perform mammography. On its surface the detector plate has auniform electrical charge. The x-ray exposure causes a discharge of the plate that is proportionate to the amount of radiation hitting each pixel. However,instead of blowing “toner” on the charged plate (as in the Xeroradiography system), the remaining charge is directly read electronically from the detector. The x-ray signal is converted directly to an electronic signal.
The detectors vary in the size of their pixels so that their spatial resolutions vary.
ANGLE OF COLLECTION
Each of the commercial systems uses a different angle through which the x-ray tube (source) travels. The x-ray tube does not have to make a majorarc above the breast to create the tomosynthesis images. It appears that just a 15 degree arc provides excellent images. In theory, however, the larger the arc the finer the “z” resolution. There are theoretical and experimental suggestions as to the optimal angle of collection and the number of projection images collected, but since no one has done a large clinical study directly comparing the major systems, it is unclear what is the best angle of acquisition and no clear understanding as to the optimal number of collection images.
HOW BEST TO OBTAIN THE PROJECTION IMAGES
Richard Moore, who was Head of Breast Imaging Research at the MGH while we developed DBT, first proposed using multiple x-ray tubes in an array above the breast and fired in sequence to generate the projection images. The advantage is that, since the tubes are fixed and don’t move, there is no chance for motion unsharpness and the speed of image acquisition is only related to the speed of reading out the detector between images. It is my understanding that this approach is,once again, under consideration.
CONTINUOUS MOTION
Some manufacturers have decided to move the x-ray tube continuously through the arc while intermittently firing the beam ateach point on the arc. This is probably the most efficient method. The only issue is if the motion of the tube during the exposure introduces “blur” into the projection images. If the exposure is short this does not appear to be a problem.
STEP AND SHOOT
The other method that is being used has the tube move, stop, “shoot”, move, stop, shoot, etc. Stopping the tube for each exposure eliminates motion during image acquisition, however, there are mechanical issues involved in moving a heavy x-ray tube stopping it and moving it again.
HOW MANY PROJECTION IMAGES ARE NEEDED?
It is not clear as to how many projection images are needed for optimal DBT imaging. Each of the companies has their own approach, but no one has compared the systems imaging the same breast, so the differences are only theoretical.
PROCESSING THE IMAGES
“Shift and Add” was the original method for processing DBT images. Some manufacturers have adopted the “filtered back projection” approach. Tao Wu PhD developed the Iterative Maximum Likelihood Technique ([8])which has major advantages over other techniques ([9]).
REVIEWING DBT IMAGES
The number of planes that are reconstructed for each set of projection images is related to the thickness of the breast. It certainly takes more time tor eview all of the planes for each patient than to review FFDM 2D images, but as discussed later, since DBT reduces the recall rate, the time saved can be accounted toward review of the DBT screening studies.
DBT IS A SCREENING TEST
REFERENCES
1.Feig SA:Hypothetical breast cancer risk from mammography:A reassuring assessment.Breast 5:2-6,1980.
2.Mettler FA, UptonAC, Kelsey CA,Rosenberg RD, Linver MN. Benefits versus Risks from Mammography: A Critical Assessment. Cancer1996;77:903-909.
3.Feig SA, Hendrick RE. Radiation risk from screening mammography of women aged 40-49 years.J Natl Cancer Inst Monogr.1997;(22):119-24. Review.
4.Hendrick RE.Radiation doses and cancer risks from breast imaging studies.Radiology.2010 Oct;257(1):246-53.
5.Yaffe MJ, Mainprize JG. Risk of radiation-induced breast cancer from mammographic screening.Radiology.2011 Jan;258(1):98-105.doi: 10.1148/radiol.10100655. Epub 2010 Nov16.Erratum in: Radiology.2012 Jul;264(1):306.
6.Miglioretti DL,Lange J, van den Broek JJ, Lee CI, van Ravesteyn NT, Ritley D, Kerlikowske K,Fenton JJ, Melnikow J, de Koning HJ, Hubbard RA. Radiation-Induced Breast Cancer Incidence and Mortality From Digital Mammography Screening: A Modeling Study.Ann Intern Med.2016 Feb 16;164(4):205-14.
7.Miller ER, McCurry EM, Hruska B. entitled “An infinite number of laminograms from a finite number of radiographs.Radiology 1971; 98:249-255
8.Wu T,Stewart A, Stanton M, McCauley T, Phillips W, Kopans DB, Moore RH, Eberhard JW,Opsahl-Ong B, Niklason L, Williams MB.Tomographic mammography using a limited number of low-dose cone-beam projection images.Med Phys.2003;30:365-80 which won The Sylvia Sorkin Greenfield Award for two of the best papers (other than Radiation Dosimetry) published in Medical Physics for 2003
9.Wu T, Moore RH, Rafferty EA, Kopans DB. A comparison of reconstructional gorithms for breast tomosynthesis.Med Phys.2004 Sep;31(9):2636-47


