TOAVOID BEING MISLED YOU NEED TO UNDERSTAND INCIDENCE, PREVALENCE, AND ANNUALPERCENTAGE CHANGE (APC)
There has been a great deal of misinformation that has made its way into the medical literature as a result of poor peer review. One of the major errors that has been allowed to confuse the importance of screening is based on a failure to understand changes in the incidence of breast cancer over time.
INCIDENCE: “Incidence” is rate of new cancers diagnosed over aspecified period of time (usually annually). In the U.S. it is often expressed as the number of cancers per 1000 women per year or sometimes the number of cancers per 100,000 women per year. Since the number of new cancers increases as women age, the annual incidence increases steadily from approximately 1/1000 atthe age of 40 to 2/1000 by age 50 to 3/1000 by age 60 and 4/1000 by age 70.
PREVALENCE: This is the total number of cancers in a population at agiven time, but when used in terms of screening it is the number of cancers detected the first time a group of women are screened. This is always a larger number than the incidence because it includes cancers that have been building up in the population before screening begins. This includes women whose cancers become clinically evident (lumps, thickening,discharge, etc.) in the year that screening begins. It also includes women who have signs or symptoms of breast cancer (lumps, thickening, discharge, etc.) that are clinically evident, but in the absence of screening have been overlooked orignored, and finally it includes the cancers that are detected only because they are found by the screening test. These are clinically occult cancers.
ANNUAL PERCENTAGE CHANGE (APC)
APC is the percent that breast cancer incidence has changed from one year to the next over time. Once screening begins the data are influenced by the detection rate of cancers. One of the major concerns is the claim that screening detects huge numbers of cancers that would never become clinically relevant. If they exist (they do not)then their detection will lead to “overdiagnosis” and treatment of “fake’cancers which is one of the (falsely) claimed harms of screening. Understanding the fact that the incidence of breast cancer had been steadily increasing prior to the start of screening is fundamental and critical for understanding the misleading claims that have been made.
One of the major pieces of information that has been overlooked in the debates about screening is what was the incidence of breast cancer doing before there was any screening. This is the “prescreening baseline”. Most would assume that the incidence is the same year after year and so it must be a straight, flat lineas depicted in Figure 1.
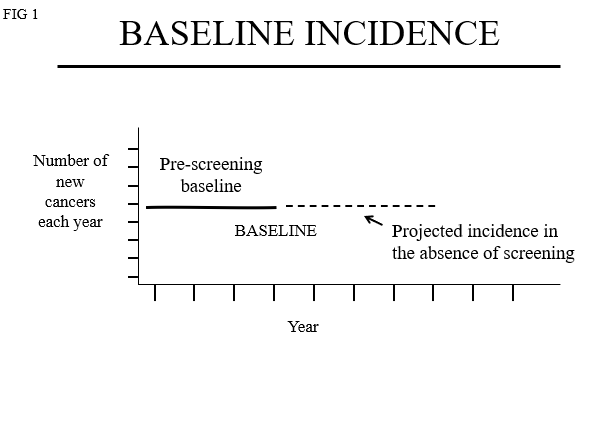
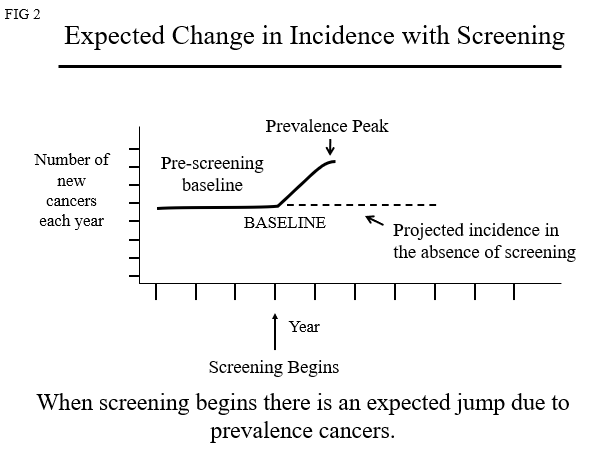
If the incidence of breast cancer is unchanged prior to the start of screening then the “Annual Percentage Change(APC)” in the baseline risk is “0” (the curve remains flat). When screening begins the start of the prevalence peak will look like figures 2.
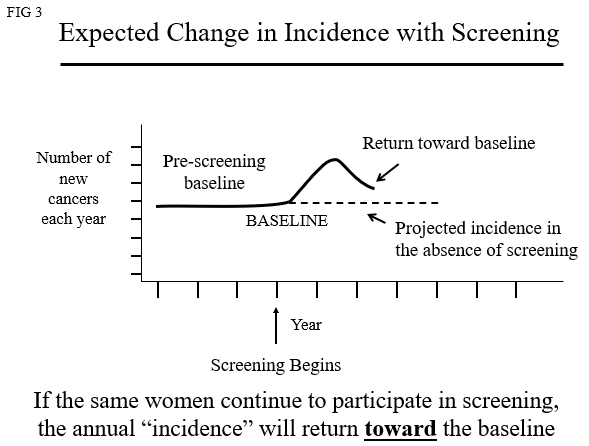
If the same women continue to be screened detecting new cancers each year (“Incidence Screening”), then the case numbers will return toward baseline (Figure 3).
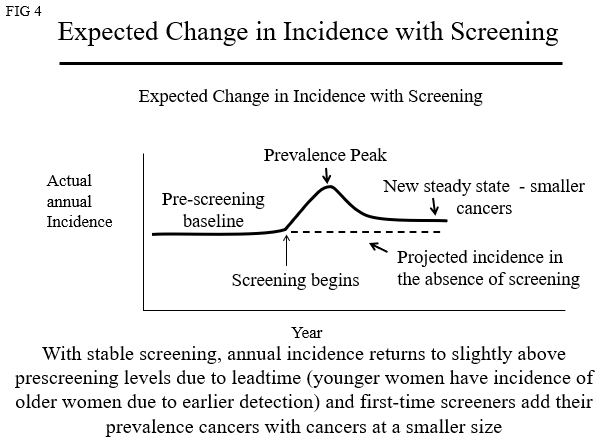
Since the cancers are coming up to the level where they can be detected at the same rate, the “incidence” will parallel the baseline but will be a little higher because new women start screening (adding their “prevalence” cancers) and since screening detects breast cancers 1-4 years earlier, the incidence curve will shift so that younger women will appear to have the incidence of women several years older(Figure 4).
However, in the U.S. (Figure 5) and around the World, the incidence of breast cancer was increasing steadily long before there was any screening. This is probably due to improvements in nutrition (menarche at younger ages) and women delaying their first full term pregnancies (early full-term pregnancy reduces breast cancer risk) as well as unidentified environmental risks.
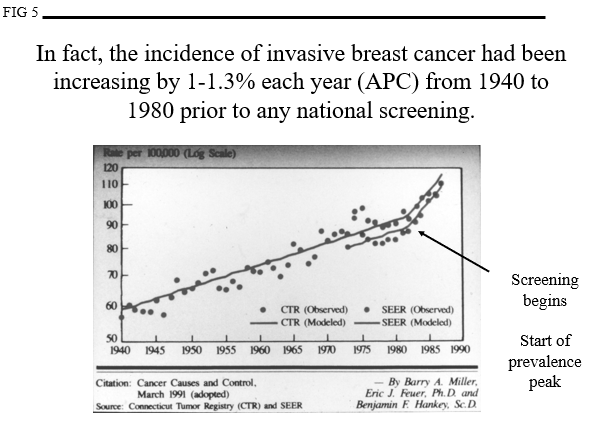
This means that the “baseline” incidence was not a flat line but was increasing each year which is shown in Figure 6.
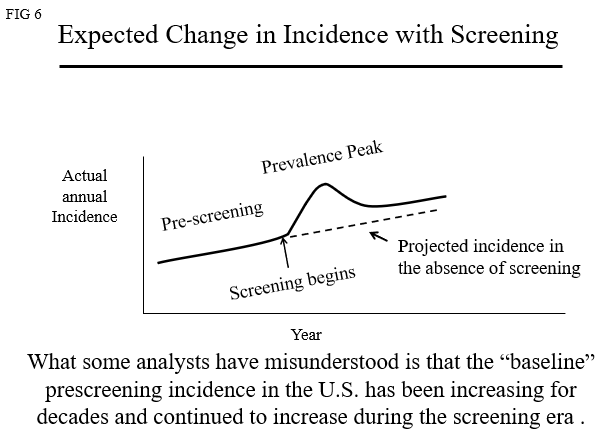
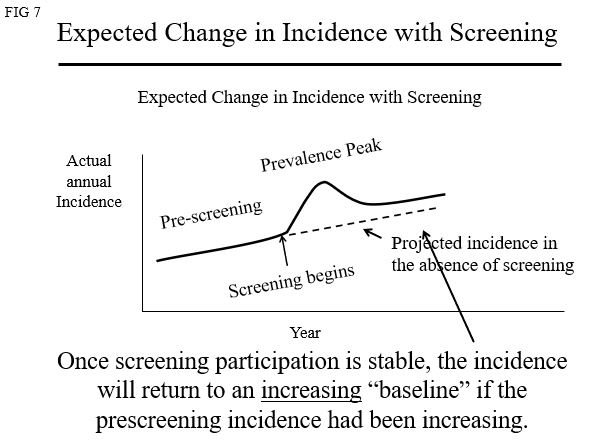
If the baseline is increasing (more women are actaully developing breast cancer each year) then the curve must be tilted to reflect an APC of 1-1.3% (Figure 7).
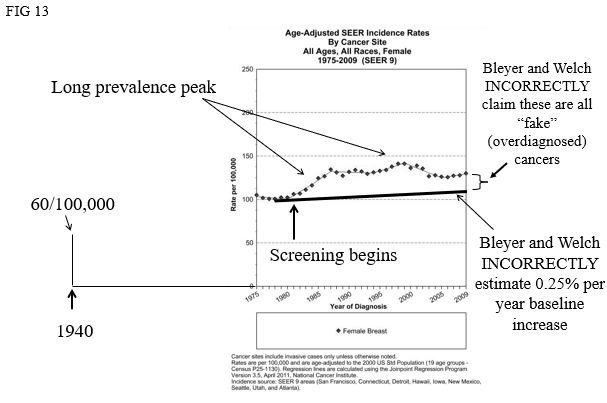
Claims of massive“overdiagnosis” have virtually all analyzed data as if the baseline was almost aflat line.
(Bleyer A, Welch HG. Effect of three decades of screening mammography on breast-cancer incidence. N Engl J Med. 2012 Nov 22;367(21):1998-2005)
or actaully a flatline
(Welch HG, GorskiDH, Albertsen PC. Trends in Metastatic Breast and Prostate Cancer. N Engl JMed. 2016 Feb 11;374(6):596)
“We started with the assumption that the underlying probability that clinically meaningful breast cancer would develop was stable [read an APC of “0%”]”.
As depicted in Figure 8
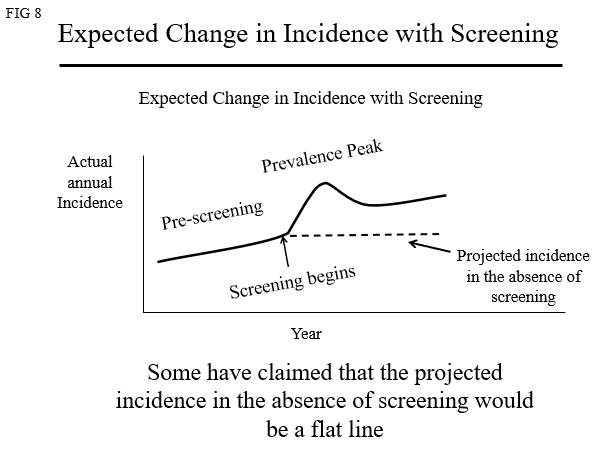
Using a claim that ignores the data, they then suggest that since the actual number of cancers is higher than what they claim it would have been in the absence of screening, then the difference must be “fake”cancers that would have never been clinically relevant in the absence of screening (Figure 9).
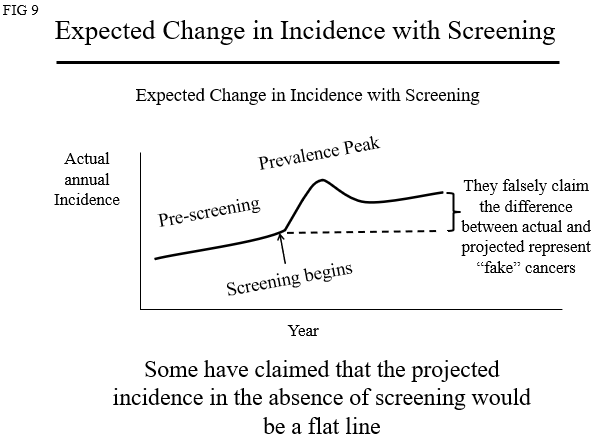
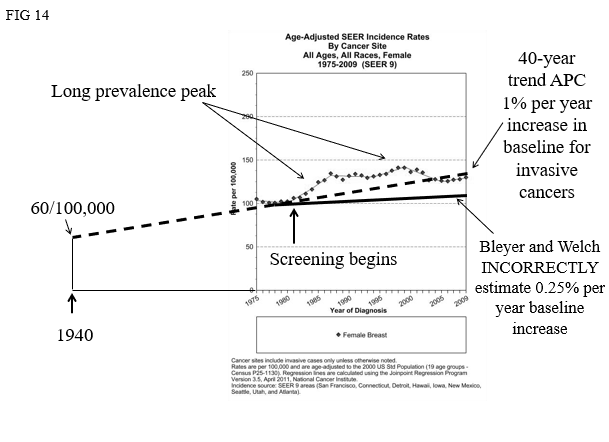
They have ignored the actual data that show that there has been a steady increase in breast cancer each year for decades prior to the start of screening with an Annual Percentage Change (APC) of 1-1.3% per year
(Anderson WF, Jatoi I, Devesa SS. Assessing the impactof screening mammography: Breast cancer incidence and mortality rates inConnecticut (1943-2002). Breast Cancer Res Treat. 2006 Oct;99(3):333-40.).
If we look atactual data from the U.S. SEER program (figure 10) we can see the errors.
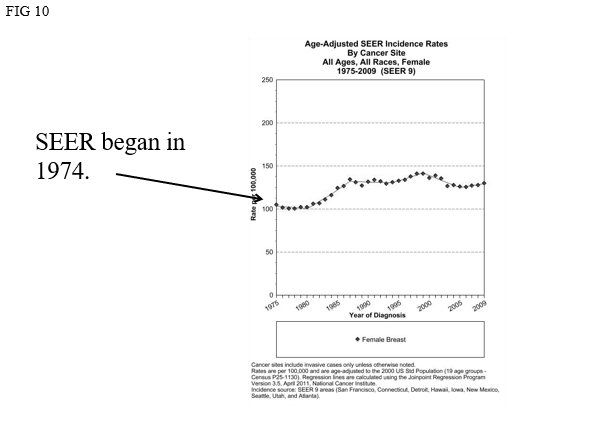
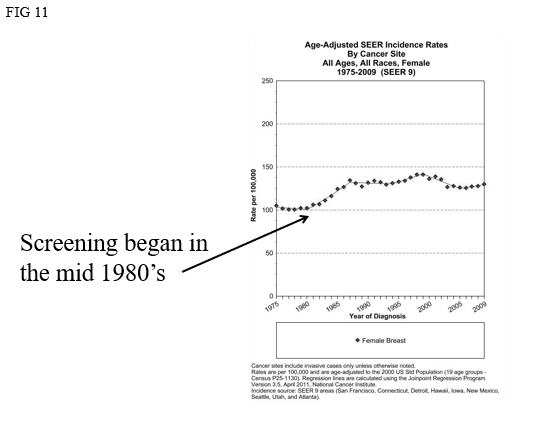
Screening began in the U.S. around the mid 1980’s (there is no national program so this was not coordinated). See Figure 11.
The prevalence peak began in the mid 1980’s but continued asmore and more women began to participate in screening. The prevalence peak in the U.S. was prolonged over many years (Figure 12).
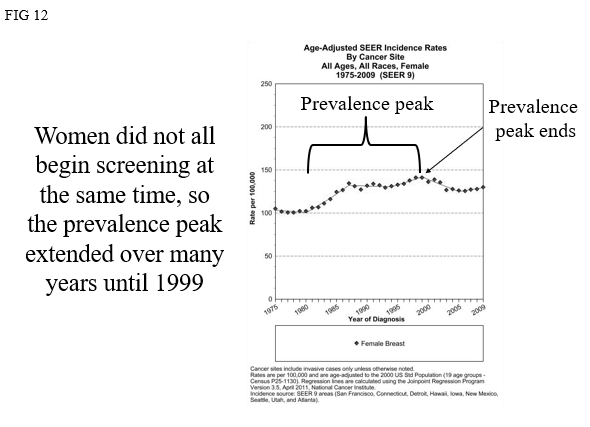
Figure 13 shows how Bleyer and Welch mischaracterized what happened in the U.S. by ignoring previous data showing a steady increase inincidence long before there was any screening. This led to their false conclusion that there has been massive“overdiagnosis” of “fake” cancers (Figure 13).
Had they used the actual data that showed an APC of 1-1.3% they would have found that the actual incidence of invasive cancer was actually LESS than what would have been expected (Figure 14).
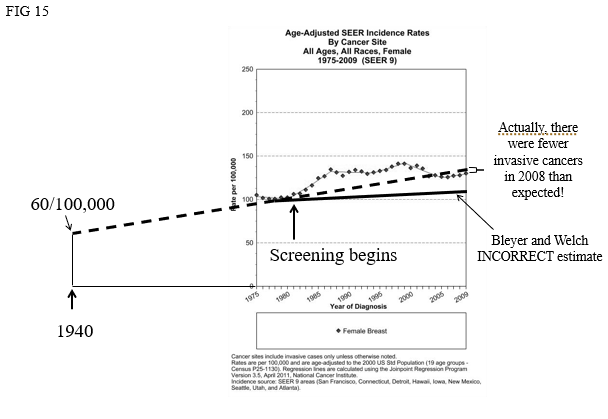
Not only was there no “overdiagnosis”, but it is likely that the removal of DCIS from the population over the preceding years has resulted in a decline in the incidence of invasive cancers (Figure 15).
(Kopans DB. Arguments Against Mammography Screening Continue to be Based on Faulty Science. The Oncologist 2014;19:107–112)
To understand the importance and impact of breast cancer screening, accurate data are needed. Physicians and women have been misled by a failure to adhere to science,evidence, and to understand the fundamentals.


