BEWARE: GROUPING AND AVERAGING DATA CAN BE VERY MISLEADING
RANDOMIZED CONTROLLED TRIALS ARE THE ONLYWAY TO PROVE THAT SCREENING SAVES LIVES
One of the major debates about breast cancer screening is the question as to what age to advise women to begin screening. The only way to prove the efficacy of an intervention is through randomized, controlled trials(RCT). The RCT’s of breast cancer screening have proven that screening women ages 40-74 saves lives (1,2). These are the ages of the women who participated in the trials. The age of 40 is the scientifically proven age at which to start screening. This does not mean that there may not be a benefit from screening younger women, nor does it mean that the benefit stops suddenly at the age of 74. It only means that, if you require “proof” that lives are saved, the RCT’s provided that proof for women ages 40-74.
FAULTY DATA ANALYSIS HAS CAUSED FUNDAMENTALCONFUSION
Years ago the investigators who ran the Health Insurance Plan of New York (HIP) RCT decided to, retrospectively,analyze their data to see if menopause had any effect on the benefits that they were seeing. Having not collected data on the age of menopause among the participants, they decided to use the age of 50 as a surrogate for menopause and they analyzed their data looking at the results for women ages 40-49 and compared them to the results for women ages 50-64. Since they had not planned to do this in advance, they did not have sufficient numbers of women to permit the reduction in deaths that they were expecting for younger women to be statistically significant, but they did the analysis nonetheless. It is fine to do retrospective subgroup analysis of data when they lack the statistical power as a way to identify new areas of investigation, but it is fundamentally wrong to advise women based on these analyses. Nevertheless, the age of 50 was given underserved importance when it appearedthat the HIP data showed an immediate benefit for women ages 50-64, while the benefit was “delayed” for women ages 40-49. Even though a “delayed” benefit is what would be expected due toperiodic screening, the fact that there appeared to be an immediate benefit for women ages 50-64, was misinterpreted as if the benefit was more robust for women ages 50-64 when this was almost certainly an artifact of statistical fluctuationthat should have been expected in the early results of screening trials (3). If a trial does not have sufficient statistical power then it should not be used to advise women. Biostatisticians have warned about this for years (4),but it has been ignored, repeatedly, in the analyses of breast cancer screening(5).
Analysts failed to remember that periodic screening is unlikely to interrupt the very fast-growing cancers that would be rapidly lethal due to “length biased sampling”. This means that it is likely that very fast growing cancers may not be detectable at one screen, and by the next screen they will have already become metastatic before they can be detected and will likely be lethal soonafter. Periodic screening is more likely to detect moderate and slower growing cancers that will still be lethal if not detected early, but it may take longer for deaths to occur. This is why screening is not expected to save lives until 5-7 years after screening begins.
When the investigators in the HIP trial decided to, retrospectively, analyze their results for women ages 40-49 compared to those ages 50-64 they were fooled by the apparent immediate benefit for women ages 50-64 over looking the fact that this was almost certainly due to chance (statistical fluctuation in the early years of a trial), and at the same time they dismissed the benefit for women ages 40-49 because it was delayed ignoring the fact that this is what was, actually expected due to length biased sampling (3). It was this initial failure to understand the science that created the false idea that the benefit of screening changed abruptly at the age of 50.
GROUPING AND AVERAGING THE DATA COMPOUNDEDTHE MISUNDERSTANDING
Once the false claim was made that there was a difference in benefit for women ages 40-49 compared to older women, there were analyses that were generated to support the concept. One often quoted paper claimed that the cancer detection rate jumped suddenly from 2 cancers per 1000 women among women ages 30-49 to 10 cancers per 1000 women ages 50-74 (6). This paper was so misleading that it led tothe false claim that
“The yield [of cancers] of the first mammogram was five times higher in women 50 years of age and older (10 cancers per 1000 studies compared with 2 cancers per1000 studies)...Clearly mammography is much more efficient in detecting breast cancers in older women." (7)
The following shows how you can make it appear as if there is a sudden change in cancer detection at the age of 50 when, actually, there is no such change.
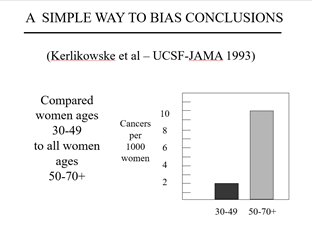
Figure 1.
This graph shows the data from reference #6. Note that they grouped the cancer detection rates for women ages 30-49 and averaged them to arrive at 2 cancers/1000 women while by grouping and averaging the detection rate for women ages 50-70+ they claimed it jumped suddenly at the age of 50 to 10 cancers/1000 women

Not only did they group and average the data to make them appear tojump suddenly, but they included women ages 30-39 with the women ages40-49. No one was arguing that thesewomen should be advised to be screened. Since there are fewer cancers among women in their thirties, it isalmost certain that they were added to pull down the average for women ages40-49 since the paper was written to suggest that we should delay screeninguntil the age of 50.
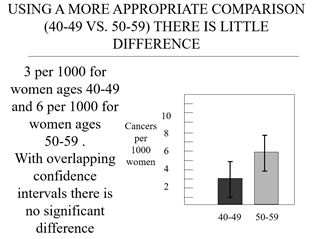
Figure 2:
These are the same data (available in the paper), but instead of dichotomous grouping they are grouped and averaged more appropriately by decades (women ages 40-49 compared to women ages 50-59). There still appears to be a sudden jump (also artificial), but the numbers are getting closer to actual reality (which is acontinuously increasing detection rate with increasing age). Grouping and averaging by decades showed that there were 3 cancers per 1000 women among those in their forties and 6 cancers per 1000 women for those in their 50’s which is closer to the facts which are that the incidence of breast cancer increases steadily each year with increasing age. Starting from age 40 it increases from approximately 10 cancers/10,000 women (I have changed to per 10,000 women to avoid decimals) by1 additional cancer/10,000 each year so that it is approximately 20 cancers/10,000 women at age 50 and continues to increase by 1 additional cancer each year to reach 30 cancers/10,000 women by age 60 and 40 cancers per 10,000 women by age 70.
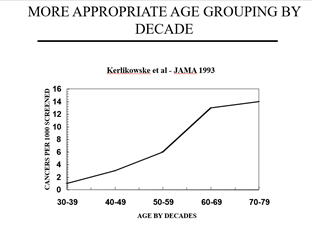
Figure 3a:
Shows that the data grouped and averaged by decade provides a more accurate demonstration as to how cancer detection rates increase fairly steadily by increasing age while
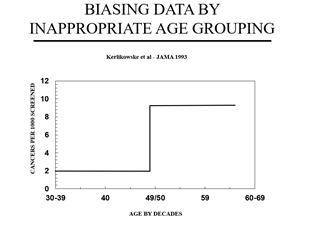
Figure 3b shows how the same data grouped and averaged dichotomously, make the cancer detection rate appear to change suddenly at theage of 50 when this is simply an artifact of inappropriately grouping and averaging the data above and below the age of 50.

To the unsuspecting reader it would appear that there is a sudden jump in cancer detection at the age of 50 when no such jump actually occurs. It is just an artifact of grouping and averaging the data. Nevertheless, even those who should know better were misled and made the false claim noted earlier, that, based on this study: “The yield [of cancers] of the first mammogram was five times higher in women 50 years of age and older (10 cancersper 1000 studies compared with 2 cancers per 1000 studies)...Clearly mammography is much more efficient in detecting breast cancers in older women."
This is simply false. The cancer detection rate does not change suddenly at the age of 50 or any other age. However, grouping and averaging the data have been used, repeatedly, to make it appear that the cancer detection rate jumps suddenly at the age of 50 when this simply false. The USPSFT averaged data by 10 year periods. The following shows how a continuously increasing variable like the annual incidence of breast cancer, that increases with each increasing year of age, can be made to look like it jumps when this is simply an artifact of grouping and averaging.
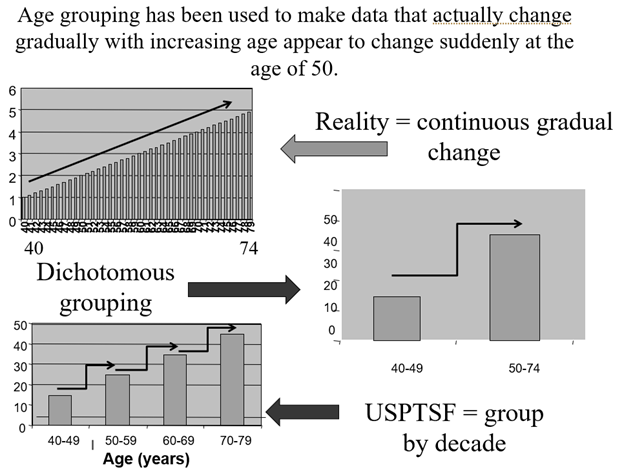
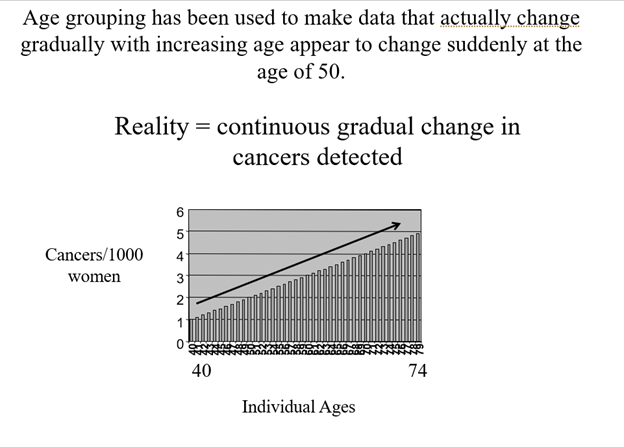
Figure 4:
I made a simple spreadsheet and graphed the data that went from 1 cancer per 1000 women at the age of 40 to 5 cancers per 1000 women by the age of 74(an increase of 0.1 per year) to simulate breast cancer detection rates by each year of age.
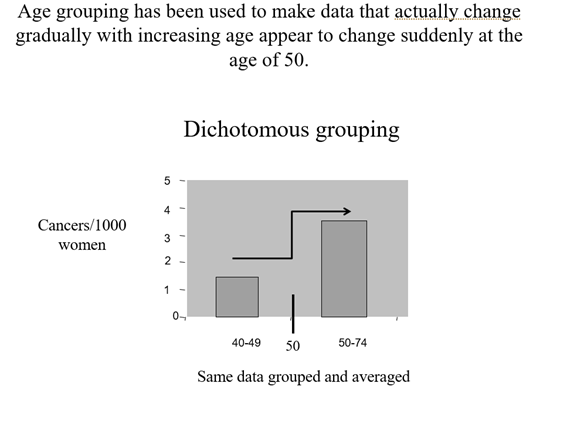
Figure 5: These are the exact same numbers as in Figure 4, except they have been added and averaged for women ages 40-49 and the same was done for women ages 50-74 to falsely make it appear that there is a sudden jump at the age of 50 when there is none.
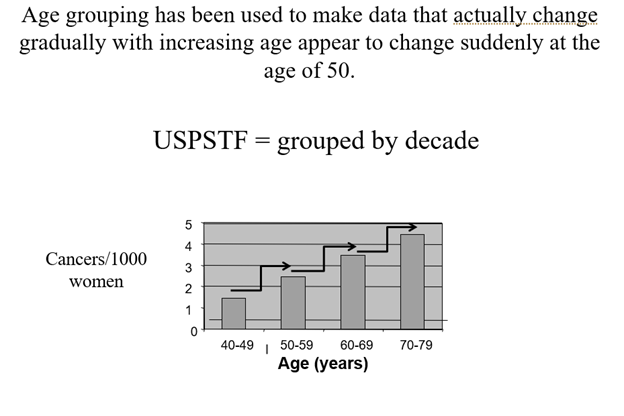
Figure 6:
The same data are grouped and averaged by each decade. This makes it falsely appear that the cancer detection rate jumps with each new decade.
BOTTOM LINE
There are NO DATA that support the use ofthe age of 50 as a threshold for screening. It is an artificial threshold that has been reinforced by scientifically unsupportable analyses. The age of 40 isthe only science-based threshold. None of the parameters of screening change abruptly at the age of 50 or any otherage when data are analyzed by individual age and not grouped and averaged (8).
REFERENCES
1 Duffy SW, Tabar L, Smith RA. The Mammographic Screening Trials: Commentary on the Recent Work by Olsen and Gotzsche. CA A Cancer J Clin. 2002;52:68-71
2 Smith RA, DuffySW, Gabe R, Tabár L, Yen AM, Chen TH. The randomized trials of breast cancers creening: what have we learned? Radiol Clin North Am 2004;42(5):793–806
3 Kopans DB.Screening for breast cancer and mortality reduction among women 40-49 years ofage. Cancer. 1994 Jul 1;74(1 Suppl):311-22. PubMed PMID: 8004602
4 Moher D, DulbergC, Wells GA. Statistical Power, Sample Size, and Their Reporting in Randomized Controlled Trials. JAMA 1994;272:122-124.
5 Kopans DB,Halpern E, Hulka CA. Statistical Power in Breast Cancer Screening Trials and Mortality Reduction Among Women 40-49 with Particular Emphasis on The National Breast Screening Study of Canada. Cancer1994;74:1196-1203.
6 Kerlikowske K, Grady D, Barclay J, Sickles EA, Eaton A,Ernster V. Positive Predictive Value of Screening Mammography by Age and Family History of Breast Cancer. JAMA 1993;270:2444-2450
7 Sox HC. Benefit and Harm Associated with Screening for Breast Cancer. New Engl J Med1998:338:1145-1146.
8 Kopans DB, MooreRH, McCarthy KA, Hall DA, Hulka C, Whitman GJ, Slanetz PJ, Halpern EF. Biasing the Interpretation of Mammography Screening Data By Age Grouping: Nothing Changes Abruptly at Age 50. The Breast Journal 1998;4:139-145.


