计算机化的报告系统
由于筛查是早期发现癌症并挽救生命的唯一机会,显然,乳腺癌筛查最重要的是使用最好的设备以获得最高质量的检查。筛查环节不仅需要高度技术熟练的放射技师来拍摄获得最好的图像,还需要资深的放射诊断医生来解读检查结果。在影像“链”中,报告系统是一个不可缺少的组成部分。报告必须是清晰,简洁,并完整说明检查的结果和需要解决的问题。如果有问题,在报告的最后需要写明进一步措施。
在筛查的最初几年,医生口述由转录员进行报告录入。不仅存在转录员不理解所讲内容的问题,而且报告往往措辞冗长、组织混乱,令人困惑。在一些筛查中使用简单的检查列表-阴性或需要额外评估。在这个报告系统里,患者仅仅被告知是正常的阴性或需要召回进行额外的检查。这种电报式的方法是存在问题的,患者会不明白诊断医生因为什么顾虑而召回她。此外,由于电报式报告缺乏更多的细节描述对比,因此对于希望通过随着时间推移而学习并不断提高诊断水平就没有任何意义了。
因此,我们开发了计算机式的报告系统。它很好的解决了这些问题。每一个放射科诊断医生对同样的发现使用相同的文字和方式进行报告描述。方便转诊医生理解检查显示的结果和后续要做些什么。计算机式的报告可以有效地收集基本数据,用来生成详细的报告同时提供明确的下一步建议措施。这些报告可以保存在数据库中,成为持续不断优化筛查质量的基础。
单屏输入
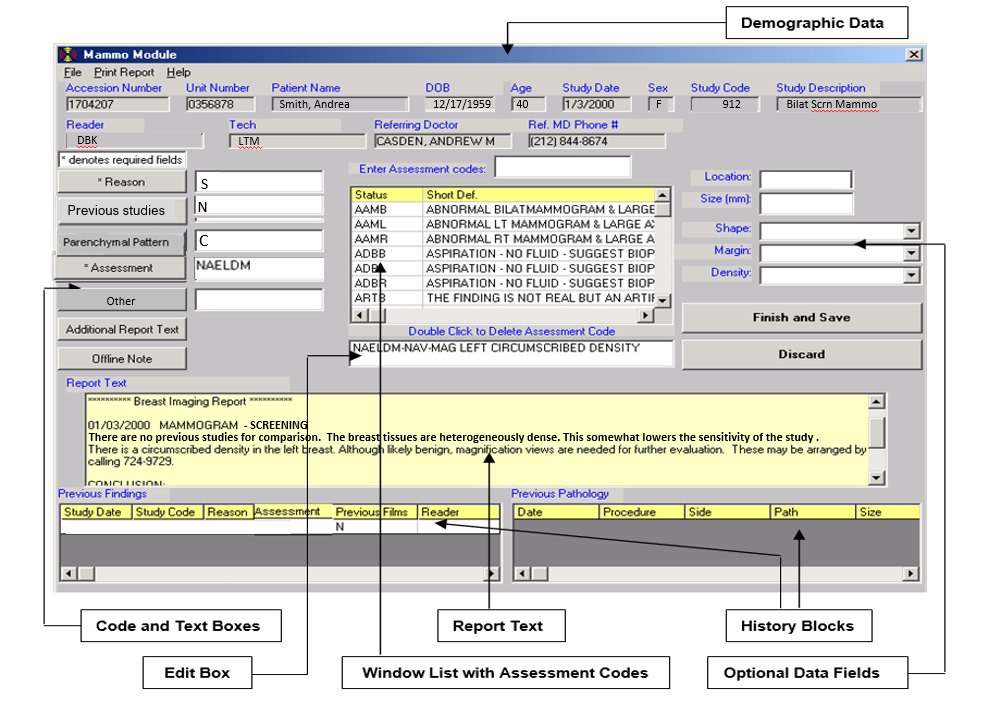
开发计算机式的报告系统的主要因素是尽可能简便易用,同时尽可能多收集这个检查相关的重要细节。系统需要高效,以便放射科诊断医生尽量花少的时间在报告屏幕,把更多的精力放在图像的阅读上。报告的输出应该是在计算机单独的屏上完成。放射科诊断医生不应该为了写一份报告而去翻看多个屏幕。因此我们开发了一个单屏系统:

屏幕的最上方显示的是提供给放射科诊断医生查看的患者基本个人信息。

下面这部分用简单的代码进行填写:

这部分空白框根据放射科诊断医生的需求进行填写,每个框内都有可允许填写的代码(只有允许的代码)。
原因
我们为这项研究开发了虚拟代码。下面举一个例子-还有更多。
S=筛查
L=患者有肿块
D=患者有分泌物
R=筛查后召回
等等。
历史检查
报告中的这部分字段说明了之前是否有做过其他检查用来对比这次检查做评估。
C=与历史检查做了对比
N=无可比较的历史检查
O=与外部检查做了对比
T=正在尝试获取外部检查的历史信息,如获得,会与此次检查进行对比后出具一份新的报告
腺体组织类型(BIRADS组织分型)
这部分字段写明了检查的敏感性。致密的腺体组织会遮盖病灶。
A:乳腺内几乎全部是脂肪组织
B:乳腺组织是脂肪,有散在纤维腺体密度区域
C:乳腺组织不均匀致密,乳腺X线摄影敏感性降低
D:乳腺组织极其致密,乳腺X线摄影敏感性降低
最终评估
下一步,在“评估”代码框内接收到3-6位方便记忆的字母,这些代码已经包含了几乎所有的成像结果。放射科诊断医生可以通过阅读器帮助记住这些代码,或者在框的中央找到代码。仅需要打字或输入代码,就可以在编辑框内或报告处插入合适的描述性短语。
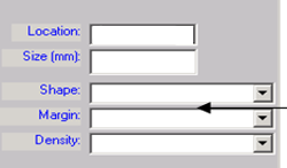
如果输入的代码所示“查找”,那么相应的可选数据字段会在右侧打开。

这里面可以记录发现病灶的位置(简易代码),大小,形状,边缘,密度(如果是肿块)(也是简易代码),以及钙化的分布,形态(也是简易代码)。
根据框内的代码,相对应的整个文字描述就显示在正确的报告位置。如果有多个发现单一代码无法覆盖时,我们可以重新进入代码框,通过输入其他的代码进行评估。同样,(检查发现)数据字段将在后面的评估中打开,代替输入报告描述的正确部分。在编辑框内双击即可删除错误的代码(从而也删除了所有相关的文字)。
生成完整的报告
基于这些简单的代码,由计算机完成一份完整的BIRADS最终评估报告。

本报告全文如下:
2000/01/03乳腺X线摄影检查-筛查
没有历史检查进行对比。乳腺腺体组织不均匀致密,在一定程度上检查敏感性降低。左乳见一边缘清晰的肿块。虽然可能是良性的,还是建议放大摄影进一步评估。可以拨打电话617-724-9729进行安排。
结论:
左侧乳房边缘清晰的致密影。建议进行额外检查的评估。
BIRADS“0”,需要额外检查评估。
其他信息
在屏幕的最下方,会提供之前所有的检查数据和结果,如果患者之前做过组织活检,还可以提供病理结果。这部分都是来源于乳房影像数据库。

所以,使用单屏将患者重要的病史提供给放射诊断医生,受计算机最小的影响,这样他们可以生成一份完整的尽可能多细节的报告。
中英翻译
Since the screening examination is the only time that an early cancer may be detected and a life saved, clearly, the most important component of a breast cancer screening program is having the best equipment to obtain the highest quality studies. The program needs highly skilled technologists who can obtain the best images possible, and highly skilled radiologists to interpret the studies. An integral part of the imaging “chain” is the reporting system. Reports need to be clear, concise and with sufficient detail to clearly define and highlight any problems. The report should conclude with a description of what, if anything, needs to be done next.
In the early years of screening, we dictated reports to be typed by transcriptionists. Not only were there issues with the transcriptionists not understanding what was being said, but the reports were often wordy, poorly organized, and confusing. Some practices used a simple check list – Negative or Needs Additional Evaluation. With that system, either the patient was to be told that everything was “fine”, or she was told that she needed to return for additional imaging. This very telegraphic technique is a problem if the patient returns and it is unclear why the radiologist who called her back was concerned. Furthermore, the telegraphic system is fairly useless for learning and improving over time since there are no details to which outcomes can be compared. Consequently, we developed a computer reporting system. It eliminated the problems. The same findings on a study were reported in the same way with the same words by every radiologist. Referring physicians had no problem understanding what the study showed and what should be done. A computer reporting system can, efficiently, collect fundamental data and use it to generate fairy detailed reports while providing clear advice as to what needs to be done next, and when saved in a data base the reports become the foundation for a program of continual improvement.
SINGLE SCREEN INPUT
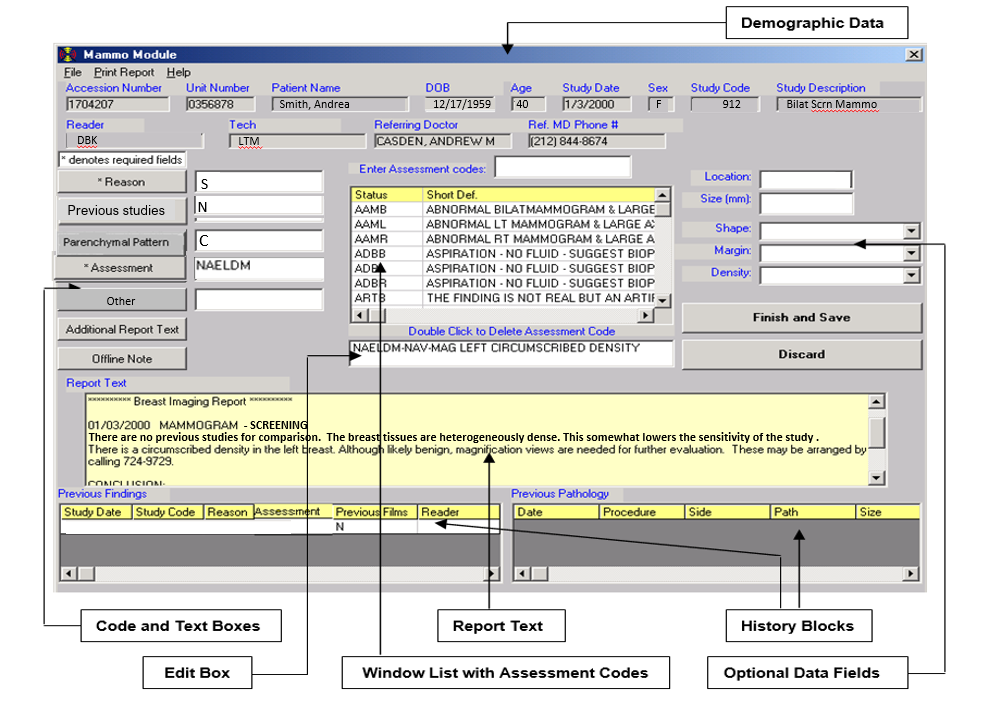
A major factor in developing a computer reporting system is to make itas easy as possible to use while collecting as much important detail about the study as possible. The system needs to be efficient so that the radiologist spends most of the time looking at the images and very little time looking at the computer reporting screen. The unput for the report should be a single screen on the computer. The radiologist should not have to page through multiple screens to generate a report. We developed a single screen system:

The top part of the screen is generated from the patient’s demographic information and is provided to the radiologist.

This next section is filled out using simple codes:

The blank boxes are filled in as needed by the radiologist. There are acceptable codes (and only acceptable codes) for each window.
REASON
We developed codes for virtually any reason for the study. Below are a sample – there are many more.
S = Screening
L = Patient has a lump
D = Patient has a discharge
R = Recall from screening
Etc.
PREVIOUS STUDIES
This field provides information in the report to explain whether other studies were used to evaluate the current study.
C= Comparison is made to the previous examinations.
N=There are no previous studies for comparison.
O=Comparison is made to outside examinations.
M=The previous studies are missing.
T=We are trying to obtain previous outside studies. If these can be obtained, they will be compared to the present examination and an addendum will be issued.
PARENCHYMAL PATTERNS (BIRADS TISSUE PATTERNS
This field provides information as to the sensitivity of the examination. The dense tissue patterns can obscure a lesion.
A: almost entirely fatty
B: scattered areas of fibroglandular density
C: heterogeneously dense – this somewhat lowers the sensitivity of mammography
D: extremely dense – this somewhat lowers the sensitivity of mammography
FINAL ASSESSMENT
Next, the “Assessment” code box receives the three to six-letter mnemonic codes, which cover virtually all breast imaging results. These are also available in the central box if the radiologist wants to scroll through to help the reader remember some of the codes. Simply typing or clicking the code(s) will insert appropriate descriptive phrases in both the edit box and report window.
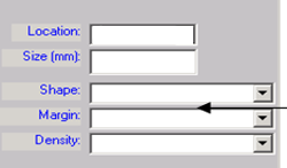
If a code is entered that implies a “finding” then the appropriate optional data fields will open on the right.

These allow for recording the location of the finding (simple codes), its size, shape, margins, and density (if it is a mass) (also simple codes), and the morphology and distribution of calcifications (also simple codes).
Based on the codes in the boxes, the appropriate full-text information appears immediately in the correct portion of the report. By returning to the assessment box, additional assessment codes may be entered to account for multiple findings when these are not covered by a single code. Again, the “findings” data fields will open for each subsequent assessment, and the information will be entered in the correct portion of the report. An erroneous code may be removed (thus removing all associated text) with a double mouse click in the edit box.
A FULL REPORT IS GENERATED
Based on these simple codes, a full report is constructed by the computer complete with a BIRADS final assessment.

This full report will read:
“01/03/2000 MAMMOGRAM – SCREENING
There are no previous studies for comparison. The breast tissues are heterogeneously dense. This somewhat lowers the sensitivity of the study. There is a circumscribed mass in the left breast. Although likely benign, magnification views are recommended for further evaluation. These may be arranged by calling 617-724-9729
CONCLUSION:
Circumscribed density in the left breast. Additional evaluation is recommended.
BIRADS “0” Needs Additional Imaging”
ADDITIONAL INFORMATION
The bottom of the screen provides data on any previous studies and their results as well as previous pathology if the patient has had any previous biopsies. These are obtained from the Breast Imaging Database.

Thus, using a single screen, the important parts of the patient’s history are provided to the radiologist who can generate a complete report with as many details as needed with minimal interaction with the computer.


